Five minutes' walk from Akihabara Station, on the 25th floor of a 40-story tower condominium, a 92 m² corner unit was put up for sale in August 2025 at ¥478 million. By December, the same unit was listed at ¥358 million. That is a cut of ¥120 million, or 25%, in 4 months.
A luxury condominium in Mita, Minato Ward, completed only in 2025. A 166 m² unit was listed in May 2026 at ¥1.79 billion. In October it was ¥1.42 billion — down ¥370 million, or 21%, in 5 months.
| Property | Size | Change in asking price | Cut |
|---|---|---|---|
| Tower condominium in Akihabara (Chiyoda Ward, 25th floor) | 92 m² | ¥478 million → ¥358 million (August → December 2025) | −25.1% |
| Luxury condominium in Mita (Minato Ward, built 2025) | 166 m² | ¥1.79 billion → ¥1.42 billion (May → October 2026) | −20.7% |
Source: Compiled by us from archived versions (Internet Archive) of listing pages on the property portal SUUMO, comparing the asking price in the first and last archived versions of the same listing page
Tracking listings in Tokyo's 23 wards that stayed on SUUMO for a long time, we confirmed asking-price cuts for 548 of 839 listings (65%). Among the listings that were cut, the median cut was −4.8%, and 98 were cut by 10% or more. These are properties that have sat unsold for months; the figures are not shares of all resale condominiums in the 23 wards.
We believe Japanese real estate entered a downward phase from 2026. This summer, condominium asking prices in central Tokyo fell for 4 consecutive months. The number of units for sale in Tokyo's 23 wards rose 25% in a year, and nearly half of the units left unsold have moved to price cuts. Meanwhile, the prices at which properties actually sold were still setting record highs through March 2026. This article lays out both sets of figures side by side and then examines the downward and upward factors one at a time. Finally, using our own tabulation of government transaction data, we show which areas and which price bands have begun to fall.
From 2026, Japanese real estate has entered a downward phase.
It will not fall all at once, however. Government transaction data show that the very center of Tokyo is still rising. Declines can already be confirmed in suburban condominiums and in the Osaka districts where private short-term rentals (minpaku) are concentrated.
For those who measure their assets in a foreign currency, the story has moved one step further. Even where yen prices have risen, the exchange rate may already have eroded the value of the investment. A property bought in 2020, for example, may be up nearly 50% in yen yet roughly flat in US dollars.
There are 4 downward factors: interest rates, unsold inventory, thinning new buying from overseas, and the exchange rate. There are upward factors too: new supply is shrinking, and people keep moving to Tokyo. This article examines both side by side.
Lumping everything about prices together leads to misreadings. This article looks at the following 6 inputs separately.
| Input | What to look at |
|---|---|
| ① Prices themselves | The prices at which properties actually sold, and asking prices |
| ② Exchange rates | The rate between the yen and the currency of the buyer's or owner's country |
| ③ Rents | The rent tenants pay and the yield it produces |
| ④ Interest rates | The policy rate, long-term rates, mortgage rates |
| ⑤ Rules on acquisition | Government tracking of acquisitions by foreign nationals; minpaku regulation |
| ⑥ Exit liquidity | Whether a buyer will appear when you want to sell |
For example, even if yen prices fall, a stronger yen restores the value measured in yuan. Rising interest rates push yen prices down, but through a stronger yen they push up the value in yuan. Each input works in a different direction, so without separating them it is easy to reach the wrong conclusion.
On September 18, 2026, the Bank of Japan raised its policy rate to 1.25%. In the two and a half years since it ended negative interest rates in March 2024, the rate has gone from 0% to 1.25%. The statement says the Bank will "continue to raise the policy interest rate" in accordance with economic, price and financial conditions, leaving room for further hikes.
| As of | Policy rate | 10-year JGB yield |
|---|---|---|
| March 2024 | 0–0.1% | 0.750% |
| January 2025 | 0.5% | — |
| December 2025 | 0.75% | 2.066% |
| June 2026 | 1.0% | 2.690% |
| September 2026 | 1.25% | 3.057% |
| October 7, 2026 | — | 3.111% |
Source: Bank of Japan, Monetary Policy Meeting statements (each meeting); Ministry of Finance, Interest Rate on JGBs (国債金利情報)
Mortgages feel these hikes right away. Of the housing loans newly made in fiscal 2024, 83.5% were floating-rate loans (by value; Ministry of Land, Infrastructure, Transport and Tourism (MLIT), Survey on Private-Sector Housing Loans (民間住宅ローンの実態に関する調査)). Floating rates are influenced by the policy rate through banks' short-term prime rates and similar benchmarks, so they tend to rise when rates are being raised. Many floating-rate loans keep the repayment amount fixed for 5 years and cap any revision at 1.25 times, so monthly payments do not jump immediately. The difference, however, goes to interest, in the form of slower repayment of principal. For new borrowers, the amount they can borrow on the same income shrinks one-for-one. For Flat 35, the fully fixed-rate mortgage, the most common rate rose to 3.83% in October 2026.
Investment properties are affected too. In the Japan Real Estate Institute's Japanese Real Estate Investor Survey (不動産投資家調査), the expected yield on a whole building of studio apartments in Tokyo's Jonan area was 3.6% (April 2026). With the 10-year JGB yield now up to 3.11%, the gap is only about 0.5 percentage points. There is little reason left to take on vacancies, repairs and even borrowing for a yield barely different from government bonds. The pressure is toward higher yields — in other words, lower prices.
The Bank of Japan itself wrote in its April 2026 Financial System Report (金融システムレポート) that "the downward trend in the yield gap, which suggests the real estate risk premium, has continued, and it is necessary to continue to pay attention to developments in real estate market conditions."
In the Tokyo metropolitan area's resale condominium market, the tide turned in the spring of 2026.
| Tokyo metro area resale condominiums (August 2026) | Figure | Year on year |
|---|---|---|
| Closed transactions | 3,180 | −10.5% (down for 5 consecutive months) |
| Listings in stock | 48,235 | +8.2% (up for 6 consecutive months) |
| Closed price per m² | ¥816,000 | −3.8% (down for 4 consecutive months) |
| Price per m² of stock (asking prices of listings) | ¥1,193,600 | +28.4% |
Source: Real Estate Information Network for East Japan (東日本不動産流通機構), Monthly Flash Report "Market Watch" (月例速報 Market Watch), August 2026
In Tokyo's 23 wards alone, the closed price per m² was −0.3% year on year, essentially flat, but it was the first decline in 76 months, since April 2020. The number of closed transactions fell sharply, by −20.6%.
The point to note is that the price per m² of the stock for sale is 1.46 times the price per m² at which units actually sold. Sellers are still pricing aggressively, but buyers are not biting at those prices, and stock is piling up.
Tokyo Kantei's asking prices (normalized to 70 m²) show that the market has moved on to the next stage.
| Area | August 2026 | Month on month | Year-on-year trend (June → July → August) |
|---|---|---|---|
| Central 6 wards of Tokyo | ¥180.68 million | −0.7% (down for 4 consecutive months) | +12.8% → +9.0% → +6.1% |
| Tokyo 23 wards | ¥126.77 million | −0.4% (down for 3 consecutive months) | — |
| Tokyo Metropolis | ¥112.74 million | −0.2% (first negative in 28 months) | — |
| Central 6 wards of Osaka City | ¥94.65 million | −0.3% (continued decline) | +18.7% → +15.9% → +13.4% |
Source: Tokyo Kantei, Monthly Trends in 70 m² Resale Condominium Prices in the Three Major Metropolitan Areas and Major Cities (三大都市圏・主要都市別 中古マンション70㎡価格月別推移), August 2026; Tokyo Kantei, Resale Condominium Market Indicators (中古マンション 市場指標)
In Tokyo's 23 wards, resale condominiums on the market, including newly listed ones, rose 25% in one year, from 12,145 units to 15,218. Among units left unsold from the previous month, the share that had been cut in price within the last 3 months rose from 36.8% to 48.9% — nearly half have moved to price cuts. Tokyo Kantei wrote that "central Tokyo, which had been taking on an overheated tone, has entered a correction phase."
New builds have also lost momentum. The first-month contract rate in the Tokyo metro area was 61.1% in August, and in most months of 2026 it was below 70%, the level regarded as the benchmark of a healthy market. Unsold inventory stood at 6,610 units, 16% more than a year earlier.
In 2026, the government's mechanisms for tracking property acquisitions by foreign nationals came into operation all at once.
| Date | What | Stage |
|---|---|---|
| October 16, 2025 | Capital requirement for the Business Manager residence status raised to ¥30 million | In force |
| April 1, 2026 | Acquisition of residential property added to non-residents' reporting under the Foreign Exchange and Foreign Trade Act | In force |
| April 1, 2026 | Nationality of a corporation's representative, officers and voting-right holders added to notifications under the National Land Use Planning Act | In force |
| October 5, 2026 | A system for declaring the owner's nationality in real estate registration begins | In force |
| October 2, 2026 | Proposal to require prior approval for transfers of ownership around important facilities and on remote border islands (Cabinet Secretariat expert panel) | Proposal stage |
None of these prohibits acquisitions outright. But the fact that the government can now see who bought what, and that even stronger rules are under discussion, gives overseas buyers a reason to hold back.
Demand from overseas is also thinning. Visitor arrivals to Japan in August 2026 diverged sharply by country and region. Travelers from countries that are calling on their citizens to refrain from traveling to Japan fell to less than half of the previous year's level, and occupancy at minpaku and hotels has dropped.
To be clear, we could not find any statistics this time showing that overseas owners are selling Japanese real estate in large volumes. That is because no official statistics count sellers by nationality in the first place. What this article argues is that new buying from overseas will weaken from here. Selling by people who own property and a decline in people newly buying are different things. Acquisitions by people living outside Japan accounted for only 2.8% even of new-build condominiums in Tokyo's 23 wards (2025, MLIT); they were never the main driver of prices to begin with. Where it matters is the particular markets where overseas buying had concentrated, such as high-end properties in central Tokyo and minpaku and investment properties.
For those who measure their assets in a foreign currency, the biggest factor is the exchange rate. Between 2020 and 2026, the yen weakened substantially against the major currencies.
We calculated, currency by currency, the gain or loss on a resale condominium in the Tokyo metro area bought for ¥100 million. The gain in yen is calculated from the change in REINS's closed price per m² (point of sale = August 2026). Fees, taxes, rent and remittance costs are not included.
| Currency | Yen per unit (2020 average → October 8, 2026) | Bought in August 2020 | August 2023 | August 2025 |
|---|---|---|---|---|
| Yen | — | +48.8% | +10.2% | −3.8% |
| US dollar | ¥106.74 → ¥158.28 | −0.7% | +0.5% | −10.5% |
| Euro | ¥121.85 → ¥177.05 | +1.4% | −5.4% | −10.2% |
| Hong Kong dollar | ¥13.76 → ¥20.17 | +0.5% | +0.7% | −10.3% |
| Singapore dollar | ¥77.41 → ¥123.47 | −7.4% | −5.1% | −11.2% |
| Chinese yuan | ¥15.47 → ¥23.62 | −3.4% | −6.6% | −16.0% |
| New Taiwan dollar | ¥3.63 → ¥4.93 (October 2, 2026) | +8.2% | +1.0% | −5.2% |
| Korean won (per 100 won) | ¥9.06 → ¥11.78 | +17.4% | +6.5% | −9.7% |
Source: Calculated by us from the Real Estate Information Network for East Japan's monthly flash reports and the European Central Bank's euro reference exchange rates (Federal Reserve Board H.10 for the New Taiwan dollar). Converted at each currency's monthly average rate
A property bought in August 2020 has risen nearly 50% in yen. In US dollars, euros or Hong Kong dollars, however, it is roughly flat. In Singapore dollars and yuan, it has lost value. Seen from overseas buyers, the rise in Japanese real estate since 2020 has been almost entirely erased by the weaker yen. Those who bought in 2025 are down 5–16% whichever currency they measure in.
Splitting Tokyo's 23 wards makes the link with the exchange rate even clearer.
| Tokyo 23 wards: resale condominium closed price per m² | Change in yen | Change in US dollars |
|---|---|---|
| Central 6 wards | +58% | +7% |
| Other 17 wards | +34% | −9% |
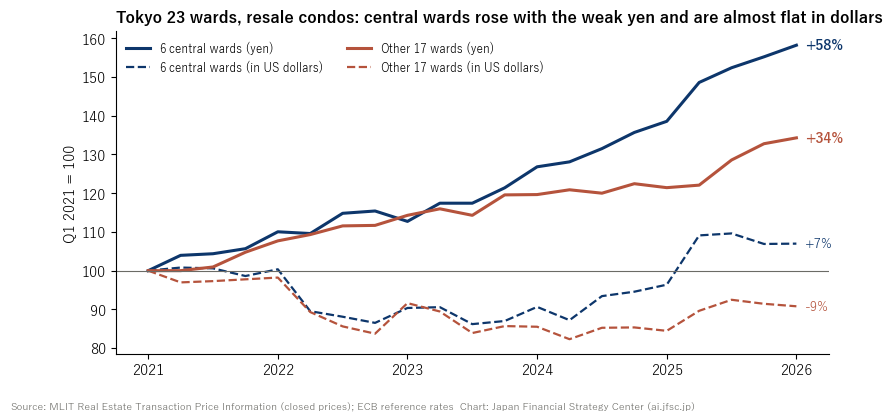
Source: Calculated by us from MLIT's Real Estate Transaction Price Information (不動産取引価格情報) (closed-transaction price data) and the European Central Bank's euro reference exchange rates (January–March 2021 → January–March 2026, converted at each quarter's average rate)
Over this period, the dollar went from ¥106 to ¥157. Prices in the central 6 wards rose by about as much as the yen weakened, and in dollars they are roughly unchanged. In effect, overseas buyers have kept paying roughly the same price in their own currency. Outside the center, prices rose only 34% in yen, and in dollars they have fallen. That is a market where domestic buyers purchase with mortgages, and what sets prices there is domestic incomes and interest rates.
From here, the story splits depending on which way the exchange rate moves. If yen prices go flat or fall, the loss in foreign-currency terms simply widens.
If the yen strengthens again, it cuts the opposite way depending on one's position. For overseas owners who already hold property, the value in foreign currency rises, and selling would capture a currency gain. For overseas buyers who have yet to buy, the same property becomes more expensive in their own currency and harder to buy. With more sellers and fewer buyers, yen prices come under downward pressure. That pressure shows up most strongly in central Tokyo, where overseas buying has been setting prices. Moreover, if the yen does strengthen, it would most likely be in a situation where the Bank of Japan keeps raising rates, which also makes mortgages heavier for domestic buyers. A stronger yen is not a support for yen prices.
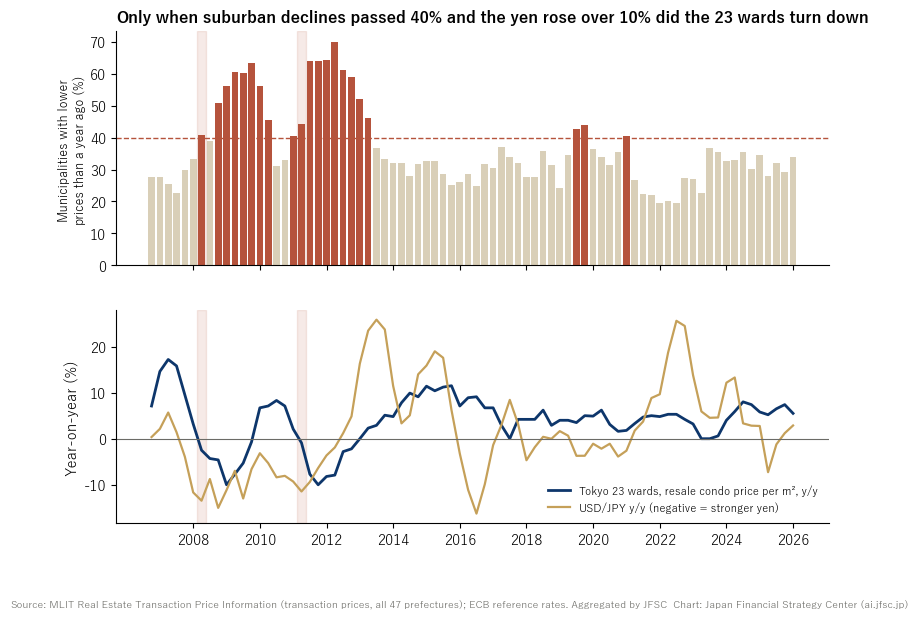
Looking back, resale condominium prices in Tokyo's 23 wards turned down twice, in 2008 and 2011, and both times the yen was more than 10% stronger against the dollar than a year earlier. Neither a spread of declines in the suburbs alone nor a stronger yen alone has dragged central Tokyo down with it (Appendix A-7). The Japan Research Institute expects the dollar–yen rate to move gradually toward a stronger yen. No one can say for certain how exchange rates will move from here.
Lining up only the downward factors would not be fair. There are genuine upward factors as well.
We nonetheless see a downward phase because these factors mainly support new builds in central Tokyo and large deals, and do not reach suburban resale condominiums or individuals' investment properties. In the next section, we check that gap against government transaction data.
MLIT has suspended publication of its Real Estate Price Index (不動産価格指数) since April 2026, citing a defect in its calculation program. The latest official index is for December 2025. We therefore obtained MLIT's Real Estate Transaction Price Information (data on each individual closed transaction) for all 47 prefectures and tabulated it ourselves through January–March 2026.
The tabulation method is set out in the appendix. Here we compare the median closed price per m² of resale condominiums in the latest 2 quarters (October 2025–March 2026) with the same 2 quarters a year earlier.
The closed price of resale condominiums in Tokyo's 23 wards was 1,075,000 yen per m² in January–March 2026. That is 11% higher than a year earlier and a new record. In the central 6 wards it was 1,684,000 yen per m², up 14%. As far as closed prices go, the heart of Tokyo has not yet fallen.
Split by price band, however, the picture is different. In the 23 wards' ¥50–100 million band, the rise in price per m² was only +1.9% year on year. Much of the 23 wards' overall +11% comes from an increase in transactions of expensive properties pushing up the average; within the same price band, prices have barely risen.
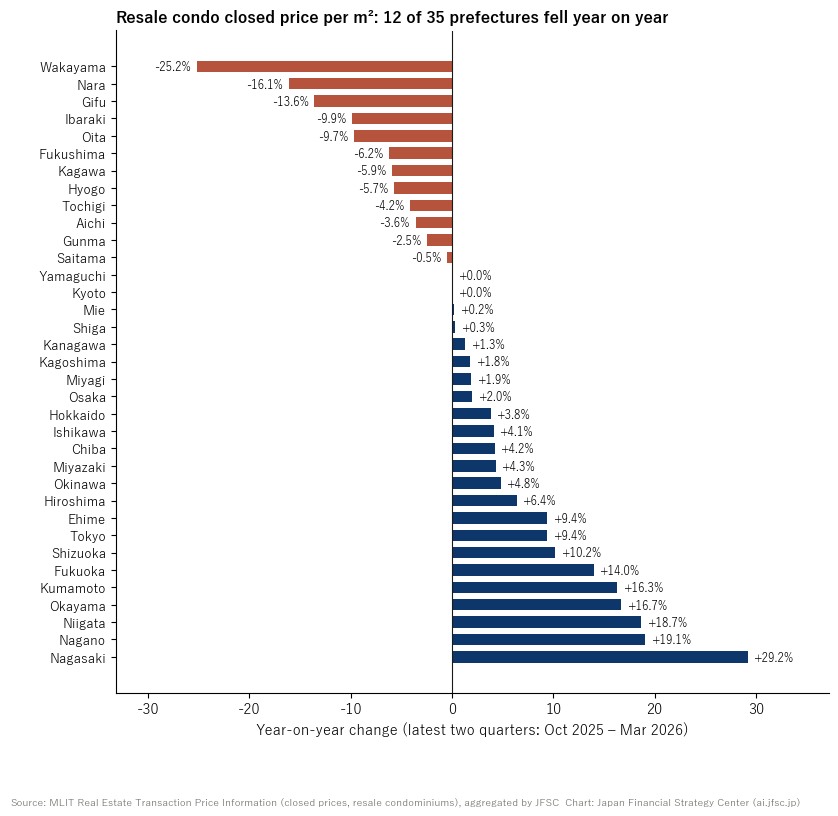
Nationwide, of the 35 prefectures with enough closed transactions, 12 were below the previous year. Among municipalities, 62 of 173 have fallen.
| Area | Closed price per m² (latest 2 quarters) | Year on year | Transactions |
|---|---|---|---|
| Machida, Tokyo | ¥414,000 | −21.6% | 157 |
| Toyonaka, Osaka | ¥356,000 | −13.8% | 331 |
| Akashi, Hyogo | ¥220,000 | −12.6% | 213 |
| Takarazuka, Hyogo | ¥257,000 | −12.3% | 207 |
| Kashiwa, Chiba | ¥367,000 | −8.3% | 228 |
| Takatsuki, Osaka | ¥324,000 | −7.8% | 160 |
| Ashiya, Hyogo | ¥382,000 | −7.4% | 163 |
| Nara Prefecture (whole prefecture) | ¥178,000 | −16.1% | 354 |
| Hyogo Prefecture (whole prefecture) | ¥314,000 | −5.7% | 3,117 |
Source: Compiled by us from MLIT's Real Estate Transaction Price Information (closed-transaction price data, resale condominiums, etc.)
Declines are coming from the Kansai suburbs, the outer ring of the Tokyo metro area, and regional prefectures. The places still rising are Tokyo (+9.4%), Fukuoka Prefecture (+14.0%) and regional core cities. This fits the logic that rising interest rates bite first in the suburbs, where people buying with mortgages have limited budgets.
In Osaka City, unlike Tokyo, prices have started to fall from the upper price bands. The ¥100 million-and-over band was −0.8% year on year, and the ¥50–100 million band −1.4%. Compared with the previous quarter, they were −4.3% and −3.6% respectively. In the city where the Expo and minpaku drew the most overseas buying, prices of expensive properties are crumbling first.
The effect of minpaku shows up even more clearly. Osaka City had 7,929 special-zone minpaku facilities as of the end of January 2026; the most were in Nishinari Ward (2,172 facilities), followed by Chuo Ward, Naniwa Ward and Ikuno Ward (538 facilities). A rush of applications before new intake closed pushed the number up to 10,132 by the end of June. Because Nishinari and Ikuno wards see only around 10 condominium transactions per quarter, we compared transactions of land and buildings, including detached houses and row houses (nagaya).
| Ward | Special-zone minpaku facilities | Land-and-building price per m² (latest 2 quarters) | Year on year | Transactions |
|---|---|---|---|---|
| Nishinari Ward | 2,172 | ¥305,000 | −3.5% | 56 |
| Ikuno Ward | 538 | ¥347,000 | −7.1% | 99 |
Source: Compiled by us from Osaka City, List of Certified Special-Zone Minpaku Facilities (特区民泊の認定施設一覧) (as of January 31, 2026), and MLIT's Real Estate Transaction Price Information (closed-transaction price data)
In the 2 wards where minpaku are most concentrated, land and building prices are already below the previous year. This decline comes while resale condominiums across Osaka City as a whole rose +5.1% year on year over the same period. These figures run only to March 2026, before the regulations took effect. We believe they reflect, ahead of time, the drop in minpaku occupancy caused by the fall in visitors.
More regulation is now piling on. Osaka City stopped accepting new special-zone minpaku applications on May 29, 2026. Existing facilities can keep operating, but they cannot add rooms. In the city's survey of actual conditions, about half of the special-zone minpaku that responded operate more than 180 days a year, so they cannot move to minpaku under the new law, which is capped at 180 days a year. In addition, an amendment to the city's hotel business ordinance was reported to have passed the city council on September 30 (scheduled to take effect on October 30). Under the city's draft amendment, starting a new hotel business in a building where people live would in principle require reinforced-concrete construction. The path of switching from minpaku to a hotel business license to keep operating has also narrowed. Properties priced on the expectation of minpaku income carry room for that portion of the price to peel away.
Closed prices were rising through March 2026, but asking prices in central Tokyo began to fall in the following months of May–August. Closed prices follow asking prices with a lag.
The 2 cases at the top of this article are part of this. Using archived versions (Internet Archive) of listing pages on property portals, we gathered how the asking prices of the same properties changed across all 23 wards. Properties that stayed listed for months are, put another way, properties that did not sell. Properties that sold disappear from the portals, so they are not included in this tally.
A ward-by-ward breakdown is given in Appendix A-5.
The waterfront — Toyosu, Harumi, Kachidoki, Ariake, Shibaura, Konan and nearby areas — is where prices rose the most in Tokyo's 23 wards over the past 5 years. We isolated the waterfront using the district names in the government transaction data.
| Closed price per m² (latest 2 quarters) | Year on year | vs. 5 years earlier | Transactions | |
|---|---|---|---|---|
| Waterfront | ¥1,846,000 | +13.6% | +92.6% | 922 |
| Of which, under ¥100 million | ¥1,244,000 | −1.8% | +31.0% | 287 |
| Of which, ¥100 million and over | ¥2,000,000 | +8.0% | +59.0% | 635 |
| Rest of the 23 wards | ¥1,022,000 | +10.5% | +34.0% | 9,919 |
Source: Compiled by us from MLIT's Real Estate Transaction Price Information (closed-transaction price data, resale condominiums, etc.). Waterfront = Koto Ward (Toyosu, Ariake, Shinonome, Tatsumi, Shiomi, Edagawa, Aomi), Chuo Ward (Harumi, Kachidoki, Tsukishima, Tsukuda, Toyomi-cho), Minato Ward (Shibaura, Konan, Daiba, Kaigan), Shinagawa Ward (Higashi-Shinagawa, Yashio)
The waterfront's closed price per m² nearly doubled in 5 years — close to 3 times the rise in the rest of the 23 wards. Even in US dollars it is up about 30%; this is a market that has risen by more than the weak yen accounts for.
Within the waterfront, however, properties under ¥100 million were already below the previous year in January–March 2026. Only properties of ¥100 million and over are rising. On asking prices too, price cuts were confirmed for 104 of the 159 waterfront properties that had been listed on SUUMO for a long time (median change −3.6%).
We see the waterfront as the market that, having risen the most, will also move the most when downward forces arrive. As shown in Appendix A-7, Tokyo's 23 wards turned down in the past when declines spread across the suburbs and the yen strengthened at the same time. If those 2 conditions line up, the first prices to be tested will be those of high-end waterfront properties.
Even with the same market analysis, what you should watch depends on where you stand.
| Reader | What to look at |
|---|---|
| Overseas investors and owners living outside Japan | The valuation in your home currency and the exchange rate — in home-currency terms, value has often already shrunk. As a non-resident of Japan: taxation on a sale (withholding tax on the price when a property is sold), remittance procedures, and filing in your country of residence |
| Overseas buyers | If yen prices fall, the terms for acquiring improve. But look at interest rates, exchange rates, regulation and rents together |
| Foreign-national owners living in Japan | In addition to yen prices, the valuation in your home currency and your cash flow in Japan; the requirements for renewing your residence status |
| Japanese owners (individuals) | Prices are falling first in the suburbs and in older buildings. Whether to sell or hold depends on the area and the price band |
| Owners holding property through a company | Whether to sell only the property or the whole company (via its shares). Tax and procedures differ greatly |
Many people hold real estate in the name of a company: asset-management companies that own rental apartment buildings, companies set up in Japan for investment, companies that own land and buildings used in their business, and so on. In that case, there are 2 ways to sell.
| Sell only the property | Sell the whole company (share transfer) | |
|---|---|---|
| What is sold | Land and buildings | The company's shares (the company keeps the property) |
| Who receives the proceeds | The company | The shareholders |
| Registration | A transfer-of-ownership registration is required | The owner remains the company; no transfer registration takes place |
| What the buyer takes on | The property only | Everything, including the company's borrowings, contracts and past tax affairs |
| Seller's net proceeds | Getting the proceeds paid to the company back to individuals requires dividends or a liquidation procedure | The shareholders receive them directly |
When the whole company is sold, the buyer examines not just the property but the company itself: registrations and lease contracts, loan terms, past financial statements and tax filings, whether there are liabilities not recorded on the books, and so on. On the seller's side, having the latest financial statements, the property documents and the loan agreements ready will help things move quickly.
For sellers who do not live in Japan, there are more points to watch. When only the property is sold, the buyer, as a rule, withholds income tax from the purchase price. When the whole company is sold, shares in a company whose assets consist mostly of Japanese real estate may also be taxed in Japan. In either case, filing in your country of residence and procedures for remitting the money from Japan are required. Because tax treatment varies with individual circumstances, confirmation with a tax accountant or other professional is essential.
Which is more advantageous depends on the property's unrealized gain, the company's borrowings, and the country where the seller lives. If you hold property in the name of a company, please consult us, including on which way of selling suits you.
Japanese real estate is not a single market. New builds in central Tokyo are still strong, while suburban resale condominiums and Osaka's minpaku districts are already falling. For those measuring in a foreign currency, value is eroding even where yen figures have risen.
In a falling market, both sellers and buyers have to look at which area, which price band and which currency the story of their property belongs to. Once selling has piled up, sellers become the side whose price is chosen by buyers.
We advise on both the sale of properties and the sale of the companies that hold them (share transfer / M&A), and consultations are available in English, Chinese and Japanese.
Sell or hold? And if you sell, the property alone or the whole company?
Talk to us about selling or buying (inquiry form)
Phone: +81-3-4500-7730 (Japan Financial Strategy Center (JFSC)). All consultations are kept confidential.
The 35 prefectures with 60 or more closed transactions. 12 prefectures were below the previous year.
| Prefecture | Closed price per m² | Year on year | vs. 2 years earlier | Transactions |
|---|---|---|---|---|
| Wakayama | ¥105,000 | -25.2% | -13.3% | 82 |
| Nara | ¥178,000 | -16.1% | -10.9% | 354 |
| Gifu | ¥205,000 | -13.6% | -9.1% | 104 |
| Ibaraki | ¥276,000 | -9.9% | -17.6% | 180 |
| Oita | ¥226,000 | -9.7% | -2.2% | 96 |
| Fukushima | ¥200,000 | -6.2% | — | 94 |
| Kagawa | ¥200,000 | -5.9% | +6.7% | 146 |
| Hyogo | ¥314,000 | -5.7% | -2.7% | 3,117 |
| Tochigi | ¥288,000 | -4.2% | +11.4% | 115 |
| Aichi | ¥270,000 | -3.6% | +2.6% | 2,745 |
| Gunma | ¥217,000 | -2.5% | +17.2% | 97 |
| Saitama | ¥371,000 | -0.5% | -7.1% | 3,018 |
| Kyoto | ¥400,000 | +0.0% | +0.0% | 1,161 |
| Yamaguchi | ¥230,000 | +0.0% | +5.2% | 101 |
| Mie | ¥225,000 | +0.2% | -4.4% | 107 |
| Shiga | ¥329,000 | +0.3% | -3.1% | 373 |
| Kanagawa | ¥507,000 | +1.3% | -3.5% | 6,227 |
| Kagoshima | ¥320,000 | +1.8% | -11.1% | 85 |
| Miyagi | ¥314,000 | +1.9% | +0.6% | 727 |
| Osaka | ¥435,000 | +2.0% | +5.5% | 5,608 |
| Hokkaido | ¥240,000 | +3.8% | +1.5% | 1,461 |
| Ishikawa | ¥243,000 | +4.1% | +21.4% | 135 |
| Chiba | ¥333,000 | +4.2% | -3.8% | 2,874 |
| Miyazaki | ¥305,000 | +4.3% | — | 61 |
| Okinawa | ¥489,000 | +4.8% | +11.1% | 192 |
| Hiroshima | ¥341,000 | +6.4% | +11.7% | 536 |
| Ehime | ¥233,000 | +9.4% | +2.1% | 64 |
| Tokyo | ¥962,000 | +9.4% | +9.8% | 13,188 |
| Shizuoka | ¥212,000 | +10.2% | +3.9% | 423 |
| Fukuoka | ¥353,000 | +14.0% | +10.4% | 2,044 |
| Kumamoto | ¥247,000 | +16.3% | +5.4% | 196 |
| Okayama | ¥311,000 | +16.7% | +8.9% | 236 |
| Niigata | ¥254,000 | +18.7% | +18.3% | 130 |
| Nagano | ¥427,000 | +19.1% | +38.0% | 109 |
| Nagasaki | ¥327,000 | +29.2% | +15.2% | 67 |
Of the 173 municipalities with 30 or more closed transactions, 62 were below the previous year. Designated cities are counted as one city, with their wards combined.
| Municipality | Closed price per m² | Year on year | vs. 2 years earlier | Transactions |
|---|---|---|---|---|
| Machida, Tokyo | ¥414,000 | -21.6% | -10.6% | 157 |
| Gifu, Gifu | ¥280,000 | -20.9% | +13.3% | 59 |
| Moriguchi, Osaka | ¥367,000 | -17.6% | -12.0% | 61 |
| Wakayama, Wakayama | ¥156,000 | -17.6% | -38.9% | 59 |
| Fujimi, Saitama | ¥360,000 | -16.8% | — | 55 |
| Misato, Saitama | ¥200,000 | -16.3% | +0.0% | 96 |
| Izumi, Osaka | ¥173,000 | -16.0% | -13.3% | 73 |
| Nara, Nara | ¥200,000 | -15.8% | -17.9% | 168 |
| Kishiwada, Osaka | ¥186,000 | -15.4% | — | 36 |
| Kurume, Fukuoka | ¥188,000 | -14.8% | -6.2% | 67 |
| Odawara, Kanagawa | ¥275,000 | -14.8% | — | 34 |
| Morioka, Iwate | ¥257,000 | -14.3% | +2.2% | 53 |
| Kashihara, Nara | ¥172,000 | -14.1% | +8.3% | 30 |
| Toyonaka, Osaka | ¥356,000 | -13.8% | -13.7% | 331 |
| Atsugi, Kanagawa | ¥276,000 | -13.8% | -10.0% | 80 |
| Kawanishi, Hyogo | ¥213,000 | -13.7% | -10.2% | 62 |
| Himeji, Hyogo | ¥160,000 | -12.7% | -5.4% | 130 |
| Akashi, Hyogo | ¥220,000 | -12.6% | +1.1% | 213 |
| Takarazuka, Hyogo | ¥257,000 | -12.3% | -16.1% | 207 |
| Anjo, Aichi | ¥213,000 | -12.2% | -16.8% | 73 |
| Kadoma, Osaka | ¥325,000 | -11.9% | +11.3% | 32 |
| Fukuyama, Hiroshima | ¥250,000 | -11.0% | +14.1% | 33 |
| Nagakute, Aichi | ¥314,000 | -10.9% | -18.5% | 44 |
| Ichinomiya, Aichi | ¥171,000 | -10.2% | -8.1% | 61 |
| Itami, Hyogo | ¥304,000 | -9.4% | -12.0% | 126 |
| Kasugai, Aichi | ¥168,000 | -9.3% | -32.6% | 75 |
| Seto, Aichi | ¥127,000 | -9.2% | — | 37 |
| Kasukabe, Saitama | ¥169,000 | -8.3% | -18.3% | 64 |
| Kashiwa, Chiba | ¥367,000 | -8.3% | -25.7% | 228 |
| Takatsuki, Osaka | ¥324,000 | -7.8% | -4.2% | 160 |
| Utsunomiya, Tochigi | ¥295,000 | -7.7% | +10.7% | 85 |
| Kamakura, Kanagawa | ¥500,000 | -7.6% | -4.8% | 85 |
| Ashiya, Hyogo | ¥382,000 | -7.4% | +2.8% | 163 |
| Koganei, Tokyo | ¥753,000 | -7.4% | +13.8% | 72 |
| Takamatsu, Kagawa | ¥200,000 | -7.3% | +3.2% | 117 |
| Inagi, Tokyo | ¥400,000 | -6.8% | -9.1% | 66 |
| Hino, Tokyo | ¥373,000 | -6.7% | +8.9% | 67 |
| Wako, Saitama | ¥450,000 | -6.3% | -2.6% | 70 |
| Kawagoe, Saitama | ¥232,000 | -5.7% | -15.2% | 146 |
| Chigasaki, Kanagawa | ¥503,000 | -5.6% | -1.2% | 116 |
| Kobe, Hyogo | ¥338,000 | -5.2% | -6.0% | 1,425 |
| Kodaira, Tokyo | ¥483,000 | -5.0% | +3.5% | 76 |
| Matsudo, Chiba | ¥267,000 | -4.8% | -4.8% | 248 |
| Tama, Tokyo | ¥331,000 | -4.7% | -28.1% | 184 |
| Chiba, Chiba | ¥276,000 | -4.3% | +10.6% | 746 |
| Ebina, Kanagawa | ¥443,000 | -3.5% | +17.9% | 85 |
| Fujisawa, Kanagawa | ¥529,000 | -3.1% | -7.8% | 265 |
| Tsukuba, Ibaraki | ¥470,000 | -2.7% | +11.0% | 50 |
| Hirakata, Osaka | ¥255,000 | -2.5% | +3.7% | 174 |
| Koshigaya, Saitama | ¥373,000 | -2.2% | -3.4% | 141 |
| Iruma, Saitama | ¥140,000 | -1.9% | +1.9% | 74 |
| Ome, Tokyo | ¥175,000 | -1.8% | +1.3% | 65 |
| Sagamihara, Kanagawa | ¥333,000 | -1.5% | -3.8% | 368 |
| Okazaki, Aichi | ¥227,000 | -1.3% | +2.5% | 95 |
| Saitama, Saitama | ¥550,000 | -1.3% | -3.8% | 782 |
| Shizuoka, Shizuoka | ¥318,000 | -0.9% | +9.1% | 75 |
| Higashiosaka, Osaka | ¥267,000 | -0.9% | +11.1% | 177 |
| Oita, Oita | ¥265,000 | -0.7% | +13.1% | 82 |
| Moriyama, Shiga | ¥185,000 | -0.6% | — | 30 |
| Kawaguchi, Saitama | ¥473,000 | -0.4% | -3.3% | 375 |
| Yamato, Kanagawa | ¥414,000 | -0.2% | -5.7% | 140 |
| Hiroshima, Hiroshima | ¥353,000 | -0.1% | +7.4% | 424 |
| Quarter | 23 wards total | Central 6 wards | Other 17 wards | Transactions (23 wards total) |
|---|---|---|---|---|
| 2021Q1 | ¥787,000 | ¥1,065,000 | ¥700,000 | 3,268 |
| 2021Q2 | ¥800,000 | ¥1,107,000 | ¥700,000 | 4,077 |
| 2021Q3 | ¥800,000 | ¥1,111,000 | ¥707,000 | 3,624 |
| 2021Q4 | ¥840,000 | ¥1,125,000 | ¥733,000 | 4,048 |
| 2022Q1 | ¥850,000 | ¥1,171,000 | ¥754,000 | 3,918 |
| 2022Q2 | ¥875,000 | ¥1,167,000 | ¥765,000 | 3,976 |
| 2022Q3 | ¥882,000 | ¥1,222,000 | ¥781,000 | 3,709 |
| 2022Q4 | ¥900,000 | ¥1,229,000 | ¥782,000 | 3,896 |
| 2023Q1 | ¥900,000 | ¥1,200,000 | ¥800,000 | 4,068 |
| 2023Q2 | ¥926,000 | ¥1,250,000 | ¥812,000 | 3,925 |
| 2023Q3 | ¥923,000 | ¥1,250,000 | ¥800,000 | 4,057 |
| 2023Q4 | ¥950,000 | ¥1,292,000 | ¥837,000 | 4,199 |
| 2024Q1 | ¥960,000 | ¥1,350,000 | ¥838,000 | 4,462 |
| 2024Q2 | ¥969,000 | ¥1,364,000 | ¥846,000 | 4,344 |
| 2024Q3 | ¥956,000 | ¥1,400,000 | ¥840,000 | 3,728 |
| 2024Q4 | ¥973,000 | ¥1,444,000 | ¥857,000 | 4,163 |
| 2025Q1 | ¥967,000 | ¥1,475,000 | ¥850,000 | 5,624 |
| 2025Q2 | ¥1,000,000 | ¥1,582,000 | ¥855,000 | 5,559 |
| 2025Q3 | ¥1,040,000 | ¥1,622,000 | ¥900,000 | 5,447 |
| 2025Q4 | ¥1,067,000 | ¥1,652,000 | ¥929,000 | 5,417 |
| 2026Q1 | ¥1,075,000 | ¥1,684,000 | ¥940,000 | 5,424 |
Condominiums = resale condominiums, etc.; land and buildings = transactions of residential land, including detached houses and row houses. Wards with fewer than 20 transactions are shown as "—". In Chuo Ward, Naniwa Ward and similar wards, land-and-building transactions include office buildings, so values swing widely.
| Ward | Special-zone minpaku facilities | Condominiums, year on year (transactions) | Land and buildings, year on year (transactions) |
|---|---|---|---|
| Nishinari Ward | 2,172 | +11.0% (24) | -3.5% (56) |
| Chuo Ward | 1,242 | +16.3% (386) | — (—) |
| Naniwa Ward | 1,232 | +12.5% (89) | — (—) |
| Ikuno Ward | 538 | — (—) | -7.1% (99) |
| Konohana Ward | 352 | +3.0% (58) | +5.5% (27) |
| Higashinari Ward | 325 | -0.1% (57) | -1.7% (32) |
| Kita Ward | 295 | +14.8% (398) | — (—) |
| Nishi Ward | 248 | -1.4% (285) | — (—) |
| Minato Ward | 231 | +27.3% (80) | +22.2% (31) |
| Tennoji Ward | 223 | +6.8% (149) | — (—) |
| Yodogawa Ward | 151 | +4.0% (232) | -8.2% (60) |
| Fukushima Ward | 149 | +11.5% (129) | — (—) |
| Suminoe Ward | 139 | -4.4% (95) | -5.7% (56) |
| Joto Ward | 128 | +6.0% (165) | +8.5% (58) |
| Taisho Ward | 111 | -7.2% (30) | +23.3% (48) |
| Abeno Ward | 90 | +11.8% (111) | -5.4% (48) |
| Higashiyodogawa Ward | 87 | +19.0% (108) | +12.1% (53) |
| Miyakojima Ward | 69 | +9.4% (138) | — (—) |
| Sumiyoshi Ward | 49 | -11.1% (76) | +0.1% (68) |
| Nishiyodogawa Ward | 44 | -3.1% (100) | +13.4% (59) |
| Asahi Ward | 19 | +40.8% (53) | -11.6% (37) |
| Higashisumiyoshi Ward | 19 | +12.6% (58) | +14.6% (71) |
| Hirano Ward | 14 | -24.6% (83) | +31.4% (75) |
| Tsurumi Ward | 2 | +7.4% (73) | -3.5% (36) |
839 listings whose same listing page was archived at intervals of 30 days or more. 548 cut, 273 unchanged, 18 raised. Median change -2.9%; median cut among the properties that were cut −4.8%.
| Ward | Listings | Share cut in price | Median change |
|---|---|---|---|
| Minato Ward | 157 | 61% | -3.1% |
| Chuo Ward | 101 | 69% | -4.2% |
| Setagaya Ward | 63 | 68% | -2.5% |
| Koto Ward | 63 | 57% | -1.8% |
| Chiyoda Ward | 61 | 70% | -3.4% |
| Shinagawa Ward | 55 | 71% | -3.0% |
| Shibuya Ward | 49 | 71% | -2.9% |
| Shinjuku Ward | 40 | 52% | -1.0% |
| Arakawa Ward | 33 | 42% | +0.0% |
| Taito Ward | 29 | 69% | -3.4% |
| Ota Ward | 22 | 64% | -3.1% |
| Kita Ward | 20 | 60% | -1.9% |
| Nakano Ward | 19 | 74% | -3.3% |
| Bunkyo Ward | 15 | 73% | -4.0% |
| Meguro Ward | 15 | 73% | -2.6% |
| Nerima Ward | 14 | 71% | -4.2% |
| Adachi Ward | 14 | 79% | -3.6% |
| Katsushika Ward | 14 | 57% | -1.6% |
| Suginami Ward | 13 | 46% | +0.0% |
| Itabashi Ward | 13 | 92% | -2.0% |
| Sumida Ward | 11 | 73% | -4.9% |
| Toshima Ward | 10 | 90% | -4.3% |
| Edogawa Ward | 8 | 62% | -2.7% |
We lined up, quarter by quarter since 2006, the share of municipalities where the resale condominium closed price per m² fell year on year (comparing the latest 2 quarters with the same 2 quarters a year earlier, and counting only municipalities with 30 or more transactions in both). Because a long series is needed, we use MLIT's transaction price information based on its questionnaire survey (with the closed-transaction price data shown alongside from 2021 onward).
| Period | Share of municipalities that fell | Tokyo 23 wards, year on year | USD/JPY, year on year |
|---|---|---|---|
| July–September 2007 | 22.5% | +15.8% | +1.4% |
| April–June 2008 | 40.9% | -2.5% | -13.5% |
| October–December 2009 | 63.5% | -0.7% | -6.6% |
| April–June 2011 | 44.3% | -0.9% | -11.5% |
| April–June 2012 | 70.1% | -7.9% | -1.9% |
| October–December 2019 | 43.9% | +5.0% | -3.7% |
| July–September 2025 (closed transactions) | 57.3% | +4.2% | -1.2% |
| January–March 2026 (closed transactions) | 35.8% | +10.6% | +2.9% |
Even in good times, around 30% of municipalities show a year-on-year decline (because medians in municipalities with few transactions swing). In 2008 and 2011, Tokyo's 23 wards turned down in quarters when this share exceeded 40% and, at the same time, the yen was more than 10% stronger against the dollar than a year earlier. In 2019, 2021 and 2025, the share exceeded 40% but the exchange rate barely moved, and the 23 wards did not fall. Conversely, in 2016 the yen was 16% stronger against the dollar than a year earlier, but only around 30% of municipalities fell, and the 23 wards did not fall. Neither the spread of declines in the suburbs nor a yen appreciation of more than 10% has, on its own, turned central Tokyo down. 2008 coincided with the Lehman shock, and 2011 with the Great East Japan Earthquake and the European debt crisis; with only 2 episodes in the data, the effect of the stronger yen cannot be separated from the effect of the crises themselves.
Q. Will Japanese real estate keep rising?
Parts of central Tokyo and high-end waterfront properties were still rising on closed prices through March 2026. On the other hand, asking prices in central Tokyo fell for 4 consecutive months in May–August 2026, and nationwide, the closed price per m² of resale condominiums was below the previous year in 12 of the 35 prefectures with enough closed transactions. We believe that, overall, the rising phase has ended and a falling phase has begun.
Q. What will happen to the waterfront tower condominiums from here?
The closed price per m² of resale condominiums on the waterfront (Toyosu, Harumi, Kachidoki, Ariake, Shibaura, Konan and nearby areas) nearly doubled in 5 years. However, properties under ¥100 million fell below the previous year in January–March 2026, and price cuts were confirmed for about two-thirds of waterfront properties that had been listed on SUUMO for a long time. Having risen the most, it is, in our view, the market that will move the most when a spread of suburban declines and a stronger yen come together.
Q. Will Japanese real estate now fall nationwide?
It will not fall uniformly across the country. In government transaction data, by March 2026 declines had appeared in the suburbs, in parts of the regions and in Osaka's minpaku districts, while central Tokyo was still rising. Asking prices began to fall in central Tokyo too in May–August, and we expect closed prices to catch up with a lag.
Q. Have I lost money on a Japanese property bought with foreign currency?
It depends on when you bought and which currency you use. For a resale condominium in the Tokyo metro area bought in August 2020, the result is +48.8% in yen, but −0.7% in US dollars, −3.4% in yuan and −7.4% in Singapore dollars. For a purchase in August 2025, it is a loss of 5–16% in every currency. The calculation does not include fees or rental income.
Q. Will foreigners no longer be able to buy Japanese real estate?
As of October 2026, there is no law that generally prohibits acquisitions by foreign nationals. Mechanisms for tracking acquisitions have started, such as reporting under the Foreign Exchange and Foreign Trade Act and nationality declarations in registration. A proposal has been made to require prior approval around important facilities and in similar areas, but it has not become law.
Q. Can special-zone minpaku in Osaka keep operating?
Existing facilities can keep operating. New applications closed on May 29, 2026, and rooms cannot be added. Switching to a hotel business license will also face stricter building requirements under the ordinance amendment scheduled to take effect on October 30.
Q. Can a company that holds real estate be sold as a whole?
Yes. It is done by transferring the company's shares to the buyer, and the property stays in the company's name. Because the buyer also takes on the company's borrowings, contracts and past tax affairs, the buyer examines the company itself in advance. Tax, procedures and the way the net proceeds are received differ from selling only the property, so the choice is made in light of the property's unrealized gain, the company's borrowings and the seller's country of residence. We advise on both.
Q. What should people living outside Japan watch for when selling Japanese real estate?
When only the property is sold, the buyer, as a rule, withholds income tax from the purchase price. Selling shares in a company that holds real estate may also be taxed in Japan. Filing in your country of residence and procedures for remitting the money from Japan are also required. In foreign-currency terms, gains in yen prices have often been eroded by the exchange rate, so the exchange rate also needs to be taken into account when deciding when to sell.

This article is based on materials published by the Bank of Japan, the Ministry of Land, Infrastructure, Transport and Tourism, the Ministry of Finance and private research firms, and on our own aggregation of MLIT's Real Estate Transaction Price Information. It is a market assessment, not a guarantee of future prices or exchange rates, and not advice on any particular property. For the tax treatment of a sale, consult a tax accountant or other qualified professional.
Medians move with the mix of properties traded; figures for areas with few transactions can swing widely.
Errors are possible. If you notice one, please tell us via the contact form and we will check and correct it promptly.
横にスクロールして拡大部分を見られます。クリックで閉じる